
Introduction
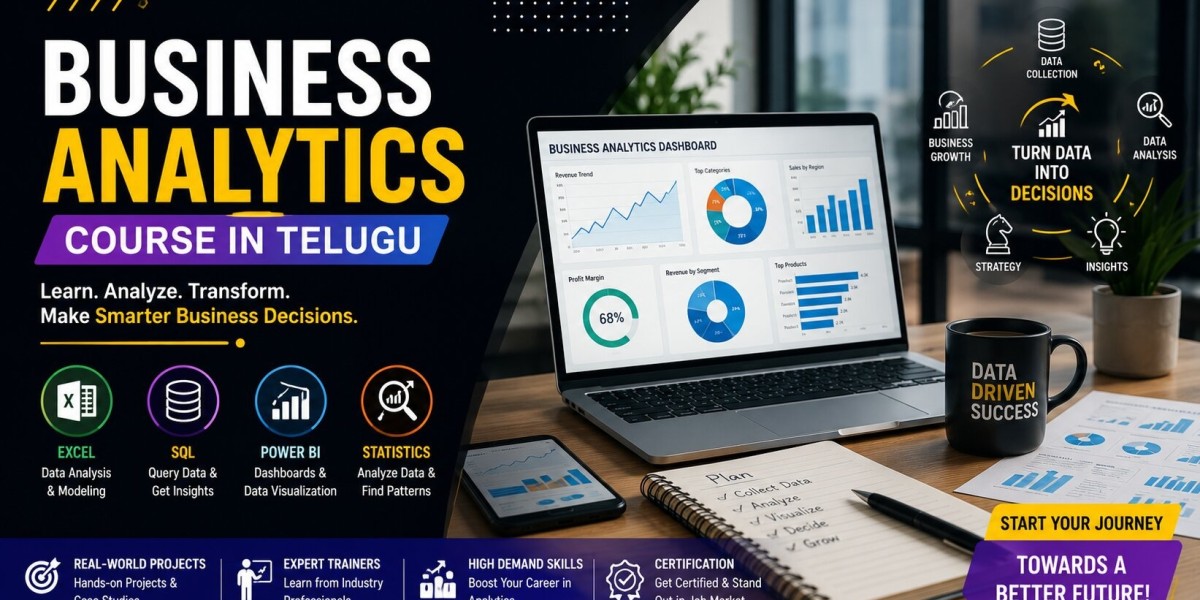
If Business Analytics were a professional kitchen, Excel, SQL, and Power BI would be its three essential tools. Each one serves a different purpose, but together they help analysts transform raw business data into meaningful decisions. Many beginners make the mistake of learning these tools independently without understanding how they work together in real business environments. In actual organizations, analysts rarely use just one application. They extract data using SQL, organize and validate it in Excel, and finally present insights through Power BI dashboards. Understanding this complete workflow is far more valuable than mastering a single tool. A Business Analytics Course in Telugu teaches learners how these technologies complement each other while solving practical business challenges across different industries.
The Journey of Business Data
Before a manager sees a dashboard, the data travels through several stages.
Imagine a chain of retail stores recording thousands of customer purchases every day.
The information first enters the company's database.
From there:
SQL retrieves the required records.
Excel helps clean and validate the data.
Power BI converts the information into interactive visual reports.
Each tool contributes to a different stage of the analytical process.
Understanding this journey helps beginners appreciate why all three technologies are important.
Excel: The Analyst's Everyday Workspace
Even with advanced analytics platforms available today, Excel remains one of the most widely used business applications.
Organizations use Excel for:
Organizing datasets
Cleaning incorrect values
Creating calculations
Performing quick analysis
Comparing monthly performance
Preparing management reports
Its flexibility makes it valuable for both beginners and experienced analysts.
Many business discussions begin with an Excel spreadsheet before moving to advanced visualization platforms.
SQL: Finding Information Quickly
Large organizations store millions of records inside databases.
Searching manually would be impossible.
SQL allows analysts to ask precise questions such as:
Which products generated the highest revenue?
Which customers placed more than five orders?
Which branches exceeded quarterly targets?
Which employees joined during the last year?
Instead of scrolling through endless tables, analysts retrieve exactly the information they need.
SQL therefore becomes the bridge between business questions and stored data.
Power BI: Making Numbers Easy to Understand
Senior managers rarely want to examine thousands of spreadsheet rows.
They prefer visual summaries that highlight important trends immediately.
Power BI transforms complex information into:
Interactive dashboards
KPI scorecards
Geographic maps
Trend analysis
Performance comparisons
Executive summaries
These visualizations allow decision-makers to identify opportunities and challenges within minutes.
An Business Analytics Course in Telugu teaches learners not only how to create dashboards but also how to design reports that communicate effectively.
A Practical Example
Consider a food delivery company.
The management team wants to improve delivery performance.
The analyst follows a structured workflow:
Step 1: SQL retrieves order history.
Step 2: Excel cleans duplicate and incomplete records.
Step 3: Power BI displays:
Average delivery time
City-wise performance
Customer ratings
Delivery partner efficiency
The management team uses these insights to improve logistics and customer satisfaction.
This demonstrates how multiple tools work together rather than independently.
Learning the Right Sequence
Many beginners ask which tool they should learn first.
A practical roadmap is:
Excel for data handling.
SQL for database access.
Power BI for visualization.
Learning in this order reduces confusion because each tool builds upon previous knowledge.
Thinking Beyond Software
Although technical tools are important, they are only part of Business Analytics.
Successful professionals also understand:
Business objectives.
Customer behavior.
Financial performance.
Operational efficiency.
Strategic decision-making.
Technology supports analysis, but business understanding creates value.
Conclusion
Excel, SQL, and Power BI form the foundation of modern Business Analytics by supporting data preparation, retrieval, and visualization throughout the analytical process. Learning how these tools work together prepares learners for real workplace responsibilities rather than isolated software training. By enrolling in a Business Analytics Course in Telugu, students can gain practical experience with industry-standard tools while understanding business problems through real-world projects. With consistent practice and continuous learning, you can confidently develop the technical skills required for a successful Business Analytics career.